
StockData.py and you'll write functions in a module
for simulated trading of stocks, in the module
StockTrader.py.
Start by snarfing the Lab 8 code from the class website. Alternatively, you can browse code here. We'll then examine how this code gets stock prices, and then slowly build up a way of graphing useful data over time.
The StockData module gives you a way of getting information about various
stocks.
The functions getWebData and getFileData return lists of stock information
acquired from the internet and from local files, respectively. Assuming
you have a network connection during lab you'll use
StockData.getWebData, that's the function called in the
main section of the module StockTrader.py that
you'll write/add-to during lab.
The getWebData takes a stock abbreviation as well as a
start/end date as parameters (see below).
Each function returns a list of tuples, each tuple has the form (date, price, volume) denoting the date of the data, the closing price of the stock that day, and the number of shares of the stock that were traded that day. These tuples will be sorted in the list from the earliest to most recent date. The stock symbol/name isn't part of this tuple. For example, the call belows gets data on Google's stock (abbreviation GOOG) from January 1, 2011 to January 1, 2012.
[('2011-01-03', 604.35, 2365200), ('2011-01-04', 602.12, 1824500), ('2011-01-05', 609.07, 2532300), ('2011-01-06', 613.5, 2057800), ...
To find the maximum price in a list of these tuples the function
get_max_price below will work (this isn't in the code
you're given):
Part I
Here you'll write code to ensure you understand the form the data's in, how to maniuplate/use tuples and how to write clear code. Answer questions on the handin pages and in the code you write.
- In function
get_max_priceabove, why is the expressions[1]used to access the price? (handin). Write a function
date_of_max_price, which takes as a parameter a list of tuples and returns the date on which the stock was at its highest price. You should be able to use it like this:data = StockData.getWebData("GOOG", "20110101", "20120101") print date_of_max_price(data) Test in
StockTrader.pyand write the code on the handin pages, or simply write did it on those pages if your code is too long (it shouldn't be though).It's easy to get confused with all the
tuple[0]'s andtuple[1]'s used to access date and price of a tuple. Using getter functions can be helpful to add semantic meaning to your code:def price(tuple): return tuple[1] Now, you can callprice(tuple)ordate(tuple)without worrying about which index goes to what. idea. Rewritingget_max_priceto use this getter:def get_max_price(data): return max([price(s) for s in data]) Write a getter function to get the number of shares traded for a tuple (write it on the handin pages).Now, fill in the
average_pricefunction. It will take a list of tuples (in practice this might be a slice of all the data), and return the average price of the stock in the list. This will be the basis of our moving average used in subsequent parts of the lab: as an example, we could callaverage_price(data[i-10:i])to get the average price for the past 10 days before dayi. If you want an added challenge, see if you can squeeze the body of this function onto a single line using a list comprehension. Try to use the getter functions. As a reminder, the average price is the total of all the closing prices divided by the number of prices/days. You can assume the list of tuples passed toaverage_priceisn't empty.
Part II: Graphing and Visualizing Data
At this point, it's time to introduce another new module: the
matplotlib.pyplot library, which is used for plotting graphs.
The matplotlib.pyplot library is imported in StockTrader.py
and we can use it to graph things. For the sake of convenience, we have used the
as keyword when importing the module so that we can call it
plt instead of its full name. The simplest form of graph is to call
the plot function with a list of data that you want to plot, and
then call the show function. There are several ways to use the
plot function, but the one we will focus on is passing 2 lists as
arguments
to it,
one of x-values and one of y-values (the two lists must have the same length).
As an example, the code plt.plot([0,1,2], [2,3,5]) followed by the
code plt.show() will plot a line segment from the
point (0,2) to (1,3) and another line segment from (1,3) to (2,5). Remember to
call plt.show(), or else your graph will not actually be displayed!
To show that you understand how to plot data, write the function
plot_prices, which takes in a list of tuples of stock data and plots all the prices of this data. This is to say, the x-values will be the indices in the list, and the y-values will be the prices at those indices.You should create a list of x-values (0 to number of elements in the list), a list of y-values (stock prices for each tuple/datum in the list) and then call
plt.plt(xvals,
	      yvals)
, for example. Your plot should be similar to what's below. Plot the prices for Apple too, stock abbreviation AAPL.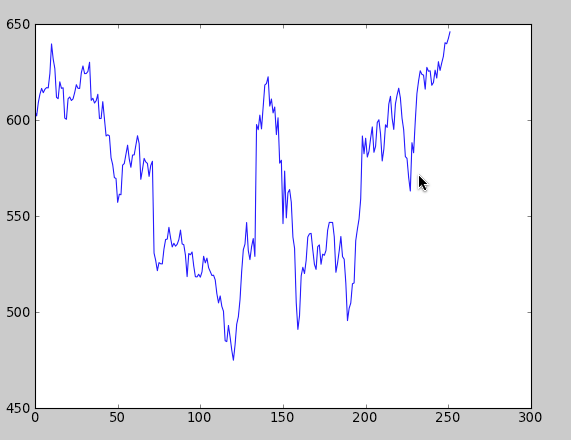
Now, let's tie all of this together. We want to know whether it's a good time to buy or sell a stock, and one way to do that is to compare the current price to the stock's average price over the past few days—if it's way above the average, it's time to sell, and if it's way below the average price, it could be time to buy.
Write the function,
plot_price_vs_average, which makes a graph of this information. For each day/tuple in the parameterdata, the could you write calculate a number for each day (after and including the 10th day): the number results from subtractig the current stock price from the average price of the previous 10 days. If this number is high (way above zero) it's time to sell, if it's low (way below zero) it's time to buy.You should calculate the values, calling the
average_pricefunction you wrote with a slice likedata[i-10:i]to get the average of 10-tuples worth of data.You should plot these values, starting with day 10. Here's a graph to help you debug, but debugging can be tricky, you may want to print some of what you're plotting/graphing.

-
It's usually a bad idea to have "magic numbers" in your code; code is more
flexible and extensible if all such numbers are replaced with variables.
Modify
plot_price_vs_averageso that the number of days used in the average is an argument to the function.